
Executive Summary
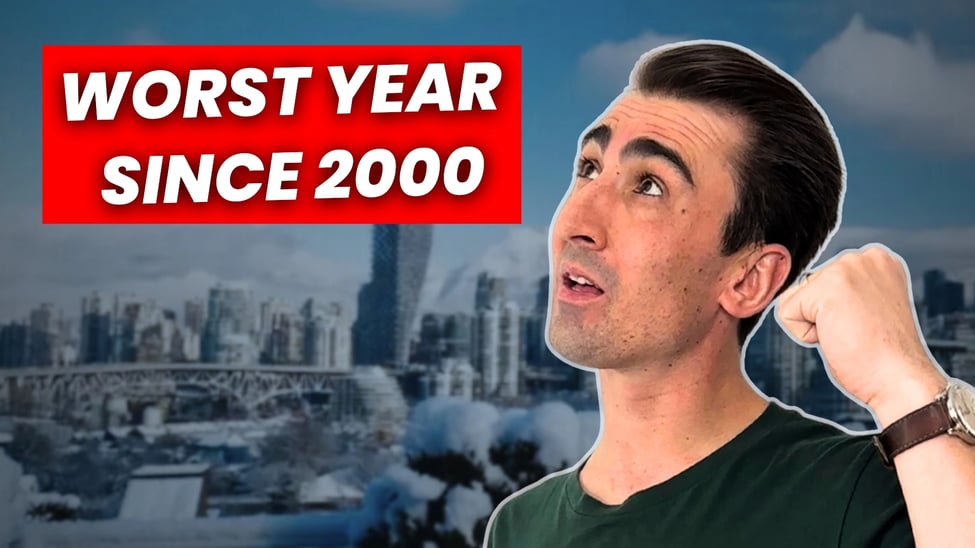
The Greater Vancouver real estate market has entered 2026 with a distinct chill. Annual sales volumes have retreated to levels not seen since the year 2000. While the macro narrative suggests a "frozen" market awaiting interest rate relief, a granular analysis reveals a bifurcated reality: specific asset classes and neighbourhoods are decoupling from the broader trend, creating pockets of high velocity amidst a general slowdown.
Watch the full video breakdown below:
Video Title: They Lied About Rate Cuts: The 2026 Realty CHECK
Macro Market Overview: The "Blockbuster Era" Lows
The defining characteristic of the current market is historically low transaction volume. Greater Vancouver ended 2025 with home sales falling 13% year-over-year in December. The total annual sales volume was the lowest recorded in 25 years.
This stagnation is driven by a widening disconnect between buyer and seller expectations, exacerbated by macro-economic factors:
- Inventory Accumulation: Total inventory is climbing as new listings outpace sales. In addition to MLS inventory, there is a "shadow inventory" of nearly 12,000 unsold new condos sitting on developer balance sheets.
- The Interest Rate Reality: Contrary to the optimism for relief, betting markets are currently pricing in zero rate cuts for 2026, with some models suggesting potential hikes. Borrowers facing renewal in 2026—the largest wave of renewals—must prepare for rates near 4%, significantly higher than the sub-2% rates seen in 2021.
- Investor Exodus: The investment case for holding property has weakened. Rents have declined 6.6% year-over-year, and vacancy rates have hit a 30-year high.
Regional Comparative Analysis
While the region-wide trend is negative, local markets are behaving differently. Below is a comparative analysis of North Vancouver, Vancouver East, and Vancouver West.
1. North Vancouver: The Condo Outlier
North Vancouver presents the most striking divergence between property types. While the detached market has contracted sharply, the condo market is outperforming the region.
Detached Market: The segment is firmly in a buyer's market. Sales plummeted 45.7% year-over-year (25 sales vs. 46 in Dec 2024). Active listings rose by 13.2%, pushing the days on market (DOM) up to 47 days, a 34% increase.
Condo Market: Conversely, condos saw a 20.0% increase in sales volume year-over-year (72 sales vs. 60). Active listings actually decreased by 6.8%, tightening market conditions.
Neighbourhood Spotlight: Lower Lonsdale led the surge with 20 sales, followed by Central Lonsdale with 18 sales. This liquidity suggests strong demand for entry-level and mid-market product despite broader headwinds.
2. Vancouver East: The Broad Correction
East Vancouver is experiencing a more uniform slowdown, particularly in the condo sector, though price adjustments are stimulating activity in key pockets.
Condo Market: Sales volume "fell off a cliff," dropping 28.6% year-over-year. Total active listings rose 3.8%, and the average days on market lengthened significantly to 42 days (+27.3%).
Detached Market: Sales saw a modest decline of 8.9%. Interestingly, the days on market actually decreased by nearly 30% (to 40 days), suggesting that sellers in this segment are capitulating faster and accepting market prices rather than languishing.
Neighbourhood Spotlight: Mount Pleasant VE remains the activity hub for condos with 23 sales, likely driven by a Benchmark Price correction of -8.3% over the last year.
3. Vancouver West: The Luxury Stalemate
The Westside detached market is characterized by high inventory and low velocity, creating a "luxury parking lot" dynamic in prestigious neighbourhoods.
Detached Market: Statistically, sales rose slightly by 4.2% (50 sales vs. 48). However, market velocity has slowed, with the average home taking 67 days to sell—a 15.5% increase from the previous year.
Condo Market: Sales dropped 8.6%, and inventory swelled by 14.7% to 1,245 active listings. The benchmark price has adjusted down by 4.7% to $782,200.
Neighbourhood Spotlight: Shaughnessy exemplifies the stalemate, with 70 active listings but only 5 sales in December. Conversely, Downtown VW condos remain liquid with 51 sales, despite a 5.3% price decline.
Data Snapshot: Year-Over-Year Comparison
| Region / Type | Sales Change (YoY) | Listings Change (YoY) | Benchmark Price Change (YoY) | Market Status |
|---|---|---|---|---|
| North Van Condos | +20.0% | -6.8% | -2.8% | Seller's/Balanced |
| North Van Detached | -45.7% | +13.2% | -3.8% | Buyer's |
| East Van Condos | -28.6% | +3.8% | -5.9% | Buyer's |
| East Van Detached | -8.9% | -1.1% | -7.6% | Buyer's |
| Van West Condos | -8.6% | +14.7% | -4.7% | Balanced |
| Van West Detached | +4.2% | -6.1% | -5.5% | Buyer's |
Strategic Insight: The Cost of Overpricing
The current market data highlights a dangerous trend for sellers known as "chasing the market." Retrospective analysis of 2025 shows that sellers who were slow to adjust to real-time conditions ended up netting 7-10% less than those who priced accurately from day one. In this climate, the "wait and see" approach is proving to be the most expensive strategy of all.
With borrowing costs likely to remain in the 4% range through 2026, the "wait and see" strategy is becoming increasingly risky. The divergence in North Vancouver suggests that where prices align with the new mortgage reality (entry-level condos), buyers are present. Where prices remain detached from fundamentals (luxury detached), liquidity dries up.
Conclusion
Navigating the 2026 market requires hyper-local data. The "Greater Vancouver" average is a misleading metric; the real story lies in the disparity between a hot condo market in Lower Lonsdale and a frozen detached market in Shaughnessy.
We are launching a new series, "What This Your Money Actually Buys You," where we go backend into the MLS to compare recent sales at identical price points across these divergent neighbourhoods. Subscribe to the YouTube channel to ensure you are making decisions based on data, not headlines.