
Vancouver Real Estate Market Update — January 2026: More Inventory, More Leverage, More Nuance
The numbers are in. Here's what Metro Vancouver's January data actually means for buyers, sellers, and anyone watching the spring runway.
January 2026 delivered more of what Vancouver's market has been producing for the better part of a year: soft sales, elevated inventory, and benchmark prices that continue to drift quietly lower. If you were hoping for a dramatic pivot — a rate-cut-fuelled spring surge, a sudden return of bidding wars — the data isn't telling that story. Not yet.
What it is telling is more useful: this is a negotiation market, and the buyers and sellers who understand that are executing better outcomes right now than those waiting for a cleaner headline.
Here's the full breakdown.
The Top-Line Numbers: January 2026 Metro Vancouver
| Metric | January 2026 | Year-over-Year |
|---|---|---|
| Total Sales | 1,107 | -28.7% |
| New Listings | 5,157 | ~+19% vs. 10-yr avg |
| Active Listings | 12,628 | +9.9% YoY / +38% vs. 10-yr avg |
| Sales-to-Active Ratio | 9.1% | Below 12% threshold |
| Composite Benchmark | $1,101,900 | -5.7% YoY / -1.2% MoM |
The single most important number in that table is the sales-to-active ratio of 9.1%. GVR's own framework identifies sustained ratios below 12% as conditions that create downward price pressure. We're there. We've been there. And it shows up in that -5.7% year-over-year benchmark drop.
Sales are running approximately 31% below the 10-year seasonal average. That's not a blip — that's a structural posture of buyer caution that isn't being resolved by rate movements alone.
The Three Forces Driving Vancouver's Market Right Now
1. Interest Rates Are No Longer the Whole Story
For years, the Vancouver market moved in near-perfect correlation with rate announcements. That relationship has decoupled. Buyer caution — driven by economic uncertainty, affordability skepticism, and a simple abundance of choice — is now doing as much work as the Bank of Canada.
OSFI's continued stress test requirements and LTI guardrails mean that qualification doesn't suddenly loosen just because bond yields tick downward. The buyers who are active right now are genuinely qualified and patient. They're not waiting to be activated by a rate cut — they're waiting for the right property at the right price.
What this means in practice: Buyers who can qualify today are often negotiating better prices and terms than they'll find in a hypothetical "better spring" that may or may not materialise.
2. The Mortgage Renewal Wave Is Creating Pockets of Motivated Sellers
The aggregate data on "median payment shock" can mask what's happening at the individual level. For borrowers rolling off ultra-low fixed terms from 2020–2021, the renewal experience is genuinely painful. This creates specific, localised motivated sellers — not a broad market panic, but concentrated situations where certainty of close matters more than maximum price.
What this means in practice: Watch for listings where sellers need clean dates, minimal subjects, and a firm deposit. These are the situations where a well-prepared buyer with a clear offer has real leverage.
3. The "Just Rent It" Exit Strategy Is Weaker Than It Was
When Vancouver rents were surging, a would-be seller had a credible alternative to accepting a low offer: pull the listing, rent the property, and wait. With rental supply increasing and rents softening, that safety valve has lost pressure. Vacant investor-owned condos, in particular, are more likely to re-price to reality.
What this means in practice: Ground-floor and investor-held condo listings — especially where a tenant has recently vacated — represent some of the best negotiating opportunities in today's market.
Vancouver By Property Type: Where You Have the Most Leverage
Detached Homes
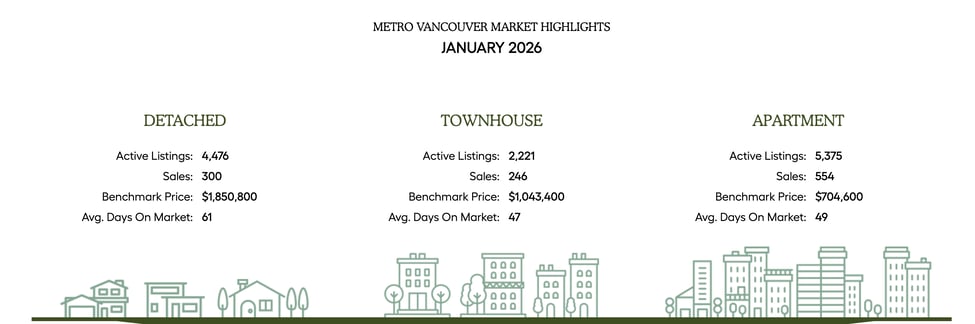
- Sales: 300 (-21.1% YoY)
- Benchmark: $1,850,800 (-7.3% YoY / -1.5% MoM)
- Sales-to-active ratio: 6.7%
Detached is the softest segment in Metro Vancouver right now. A 6.7% sales-to-active ratio means sellers are competing hard for a small pool of active buyers. Conditional offers are getting accepted. Price reductions are happening. If you're a detached buyer with financing and flexibility, this is the most leverage you've had in years.
Townhomes (Attached)
- Sales: 246 (-23.4% YoY)
- Benchmark: $1,043,400 (-5.4% YoY / -1.2% MoM)
- Sales-to-active ratio: 11.1%
Townhomes are holding up better than detached — the 11.1% ratio is closest to the 12% "balanced market" line. Buyers still have leverage, but well-priced, well-maintained townhomes in desirable neighbourhoods are moving. The gap between a strong listing and an average one is widening.
Condos (Apartments)
- Sales: 554 (-34.5% YoY)
- Benchmark: $704,600 (-5.9% YoY / -0.8% MoM)
- Sales-to-active ratio: 10.3%
The condo segment is experiencing what you might call selection fatigue. There's a lot to look at, and buyers are becoming highly discriminating. Units with clean strata histories, strong financials, good layouts, and in-demand buildings are still moving. Everything else is sitting — and sitting longer creates room for negotiation.
Neighbourhood-by-Neighbourhood: Metro Vancouver Breakdown
Vancouver East
- Benchmark: $1,697,600 (-8.1% YoY)
- Sales: 34 (+13.3% YoY)
- Condo sales-to-active: 12.4% | Townhomes: 8.1% | Detached: 6.6%
East Vancouver is "busy but not competitive." There's genuine buyer activity — sales are actually up year-over-year — but buyers are arriving with inspectors, asking questions about permits and strata, and pressing on price where condition doesn't match asking. The condo segment at 12.4% is the closest thing to a balanced micro-market in this report.
Vancouver West
- Benchmark: $2,956,400 (-12.2% YoY)
- Sales: 29 (-17.1% YoY)
- Condo sales-to-active: 9.5% | Townhomes: 8.8% | Detached: 4.8%
The West Side is where aspirational pricing is getting the clearest market feedback. A detached sales-to-active ratio of 4.8% is firmly in buyers' market territory. If you're a buyer with clean terms targeting detached on the West Side, the data supports a serious negotiating posture. The -12.2% year-over-year benchmark drop is the steepest in this summary.
North Vancouver
- Detached benchmark: $2,037,600 (-6.9% YoY)
- Detached active listings: 264 (+24.5% YoY)
- Detached DOM: 50 days (up sharply)
- Townhome benchmark: $1,269,900 (-7.5% YoY)
- Townhome active listings: 112 (+40% YoY)
North Vancouver still commands a lifestyle premium — the mountains, the trails, the schools, the community character haven't changed. But buyers are no longer paying a "because North Van" tax without scrutiny. Parking, storage, layout quality, and building condition are the deciding factors. Days on market at 50 for detached is a significant shift from the frenetic pace of 2021–2022.
Quick Regional Benchmarks (Detached)
For context across the broader Metro region:
- Port Moody: $1,997,100 (-2.6% YoY)
- Port Coquitlam: $1,340,100 (-4.2% YoY)
- New Westminster: $1,473,300 (-8.3% YoY)
- West Vancouver: $2,914,000 (-8.2% YoY)
Port Moody's relative resilience (-2.6%) stands out against the steeper drops in New Westminster (-8.3%) and West Vancouver (-8.2%). Micro-market location and product type are doing more work than broad Metro trends right now.
What This Means If You're Buying in Metro Vancouver Right Now
The opportunity is real — but it requires preparation, not patience.
The buyers winning in this market aren't waiting for the perfect rate environment. They're getting pre-approved, locking in rate holds, and approaching stale or recently-reduced listings with clean, well-structured offers. Here's the practical playbook:
Step 1: Get pre-approved and lock in a rate hold. In a market where uncertainty is suppressing demand, being genuinely ready to buy is itself a negotiating advantage.
Step 2: Target by micro-market and building quality, not just postal code. The gap between a well-run strata with healthy financials and a poorly-managed building with deferred maintenance is wider than it's ever been — and buyers are learning to see it.
Step 3: Look at stale and recently-reduced listings first. The best value in a buyer's market is typically found in properties that were overpriced, sat, reduced, and are still sitting. That's where the seller's urgency has had time to build.
Step 4: Offer with clean terms where due diligence is genuinely satisfied — not to seem brave, but because a clean offer carries real weight to a seller who has watched conditional offers fall apart.
What This Means If You're Selling in Metro Vancouver Right Now
The market is paying for certainty. Price is your marketing.
In a market with 38% more active listings than the 10-year seasonal average, "let's test it high and see what happens" is a strategy for stale DOM and a price reduction that signals weakness to buyers. Sellers who are winning right now are doing three things differently:
Price to be the best value in your comp set from Day 1. Not "the nicest story" — the clearest value. Buyers in this market are doing more research than ever, and they will identify overpricing within hours of your listing going live.
Pre-empt objections before they become conditions. Get the inspection done. Pull permits. Prepare your strata documents. Document recent upgrades with receipts. Every unanswered question a buyer has is a reason to include a subject — or walk.
Build your plan around realistic DOM. Spring will help good listings. It will not save weak ones. Set price review dates in advance, maintain showing momentum, and be ready to make decisions before the listing goes cold.
The Pre-Sale vs. Resale Dynamic: Why It Matters Even in a Resale Market
One of the more interesting structural dynamics right now: new condo pre-sale pricing in Metro Vancouver is, in many cases, materially higher than comparable resale. When that gap is wide enough, buyers simply choose resale — and that's shifting demand in meaningful ways.
For resale condo sellers, this is actually an opportunity. If your unit represents better value than a comparable pre-sale (better price per square foot, immediate occupancy, known strata history, no completion risk), that narrative needs to be part of your marketing. The comparison is happening whether you participate in it or not.
Frequently Asked Questions: Vancouver Real Estate Market, January 2026
Is Vancouver in a buyer's market right now? Based on January 2026 data from the Greater Vancouver Realtors (GVR), Metro Vancouver's overall sales-to-active ratio is 9.1% — below the 12% threshold that GVR associates with conditions favouring buyers. The detached segment is even softer at 6.7%. By the standard technical definition, Vancouver is in a buyer's market, particularly for detached homes and condos.
Are Vancouver home prices dropping in 2026? The Metro Vancouver composite benchmark price in January 2026 is $1,101,900, down 5.7% year-over-year and 1.2% month-over-month. Prices are declining gradually across all property types, with detached homes seeing the steepest drop (-7.3% YoY) and condos down 5.9% year-over-year. This is a slow drift, not a crash.
What is the benchmark price for a condo in Vancouver in 2026? The Metro Vancouver apartment (condo) benchmark price in January 2026 is $704,600, down from approximately $749,000 a year earlier. This represents a 5.9% year-over-year decline and a -0.8% month-over-month movement.
What is the best Vancouver neighbourhood to buy real estate in 2026? East Vancouver is showing relative resilience with condo sales-to-active ratios at 12.4% — close to balanced market conditions — and sales volumes that are actually up year-over-year. For buyers seeking the most active micro-market with realistic negotiating room, East Van's data stands out in the January 2026 report.
How long are homes sitting on the market in North Vancouver right now? North Vancouver detached homes are averaging 50 days on market as of January 2026, up sharply from prior years. Active listings are up 24.5% year-over-year, giving buyers significantly more selection and negotiating leverage than they had during the 2021–2022 peak market.
Should I wait for more interest rate cuts before buying in Vancouver? The January 2026 data suggests the market is no longer responding to rate movements the way it historically did. Buyer caution and elevated inventory are doing more to suppress demand than rates alone. Buyers who can qualify today often have more negotiating power than buyers waiting for a hypothetical rate-triggered surge — which, if it arrives, will reduce both selection and leverage simultaneously.
What is the sales-to-active ratio in Vancouver and why does it matter? The sales-to-active ratio measures what percentage of active listings are actually selling in a given period. GVR considers ratios below 12% indicative of conditions that can lead to downward price pressure, ratios between 12%–20% as balanced, and ratios above 20% as conditions favouring sellers. Metro Vancouver's January 2026 ratio of 9.1% overall (6.7% for detached, 10.3% for condos) signals a market that continues to favour buyers.
Are Vancouver condo prices expected to rise in spring 2026? Seasonal patterns typically bring increased activity in March through May. However, with active listings running 38% above the 10-year average and sales roughly 31% below average, a spring rebound would require a significant demand catalyst. The current data supports a cautious outlook: spring may help well-priced, well-positioned listings, but is unlikely to reverse the broader trend of elevated inventory and soft pricing.
Data sourced from the Greater Vancouver Realtors (GVR) January 2026 Statistics Package. All benchmark prices reflect MLS® HPI composite figures. Market conditions change — contact us for current, property-specific guidance.